Track any event in your app with Parse Analytics
We are pleased to announce that Back4App has recently launched a new advanced, innovative feature for its customers, and that is the ‘Parse Analytics Tool.’ The end goal of rolling out this ready-to-use feature is to gather and analyze accurate, relevant event data to better understand your users as well as track data-driven reports to monitor the health and performance of your app in real-time. This tool helps you to improve your app to achieves better performance and successfully meets your business’s pre-defined goals like conversion and engagement rate.
Using Back4App analytics tool you can have a clear picture of your user engagement, configure unlimited specific event reports to optimize your business, track push messages and App-opens, have insights of which queries you can fix to improve your app performance and dissect all the API data in real-time. Let’s take a look at its valuable features and benefits:
Contents
Measure App Usage
The real struggle about in-app usage is not only to measure user engagement, but also to keep tabs on it and optimize it effectively. Back4App uses its robust mobile SDKs to collect, by default, some user data and plot important usage reports audience reports to quickly analyze and track stats as well as metrics associated with mobile app usages.
In this, you will view and get real-time information about your active users, app open rate, and other significant engagement metrics via your dashboard. Using audience reports, you can discover the total number of installs thru the lifetime of your app over a specified time interval. Next, these reports assess and show the predictive information about your Daily Active Users (DAU) who open your app at least one time in a day, Weekly Active Users (WAU) who use your app over one week, and Monthly Active Users (MAU) who engage with your app on a monthly basis. By comparing your DAU to MAU, you can instantly measure the stickiness, growth rate, and popularity of your app. In a nutshell, these metrics allow you to track the total number of active users as well as how frequently they are using your app throughout a defined time cycle.
In addition to that, we empower our customers to keep track of their daily app launch wherein they can facilely view the exact figure displaying how many times their app was opened during a single day. The audience reports also allow you to keep an eye on the duration of each session duration so you can measure the definite time spent by your users per visit on your app after launching it. These reports create a record of the time to identify when a session was opened or closed, thereby allowing you to evaluate the length of a particular session as well as the intervalof time between two sessions.
Since the app usage metric is essential to optimize conversions, retain users, and improve an application’s utility, we have explained how you can meritoriously track your app usage and engagement metrics using the audience report in this guide, so check it out now!
Free and Unlimited
Parse Analytics is a free, intuitive app analytics tool provided by Back4App that allows you to measure your app’s traffic, gather insightful data about your app visitors, conduct an in-depth visual analysis of data trends, and create unlimited custom reports, thereby enabling you to track your app’s progress and understand how it is performing in real-time.
Track Custom Analytics
Our custom event tracking and timeline analysis features enable users to monitor and view all critical activities that happen on your app, even those that can’t be tracked using a standard event tracking tool, such as ads, saves, click-based downloads etc. In this, you will be able to monitor any user interaction with your app content by wrapping that particular action in a single line of frontend code. To do so, you must tag the dimensions related to the custom event in your tracking code to collect data about users’ interactions and key conversions with interactive elements of your app.
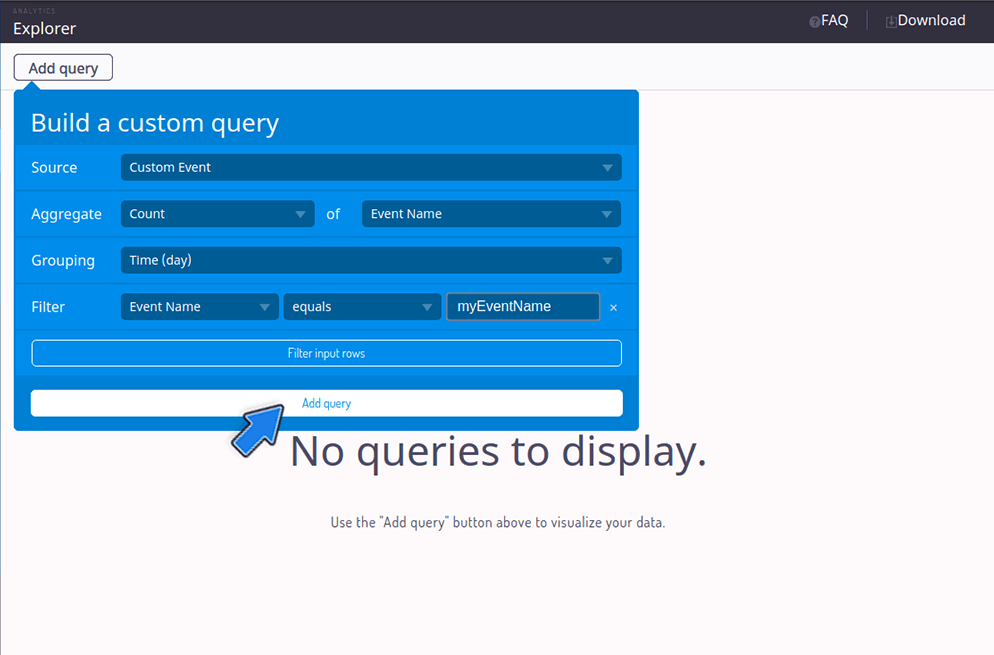
We also allow you to set up your own events that are customizable to satisfy your specific needs with just a few lines of code, irrespective of the platform or device being used. All you need to do is send us the data like event properties, and we’ll break it down through labels, values, actions, and categories for you so you can record the action in real-time on your dashboard. Once you have a snippet of code at your disposal, these events will appear in the tracking analytics reports as well as trigger automated message. To find more comprehensive implantation details for JavaScript, Android, Xamarin/Unity, iOS-ObjC, and iOS-Swift, check out this our app event tracking guide.
Overlay Graphs
When you sift through a lot of data for your analytics reporting, it can get overwhelming to manage several content resources comprising multiple sources of data. That’s why Back4App empowers you with the potent weapon ‘Overlay Graphs’ to visualize and analyze your multiple data points so you can effectively and clearly extract endless insights and actionable information form it.
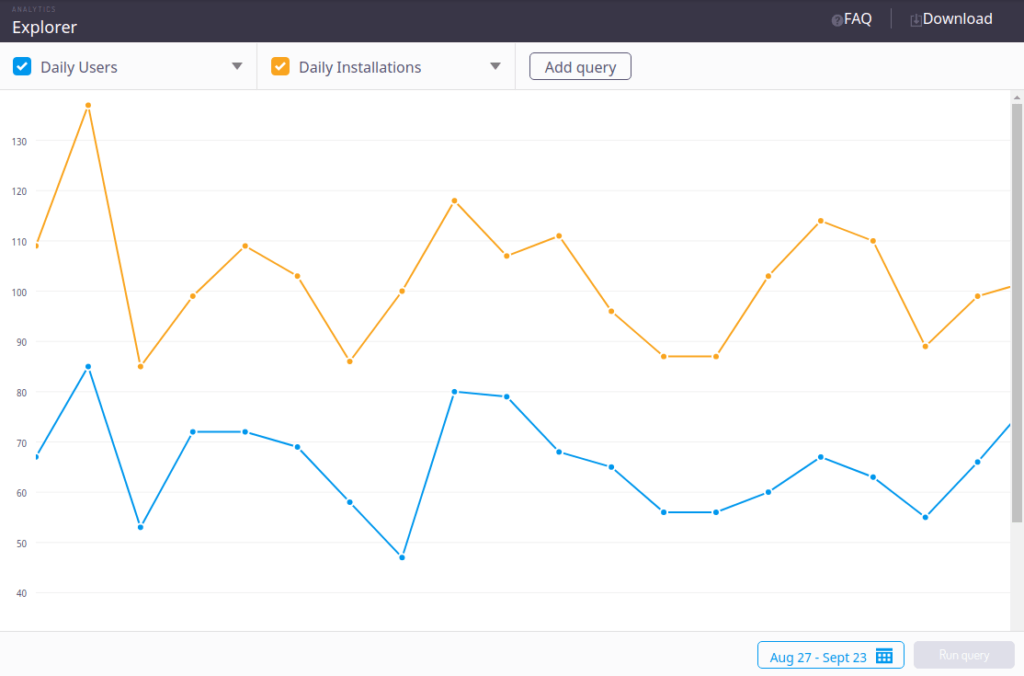
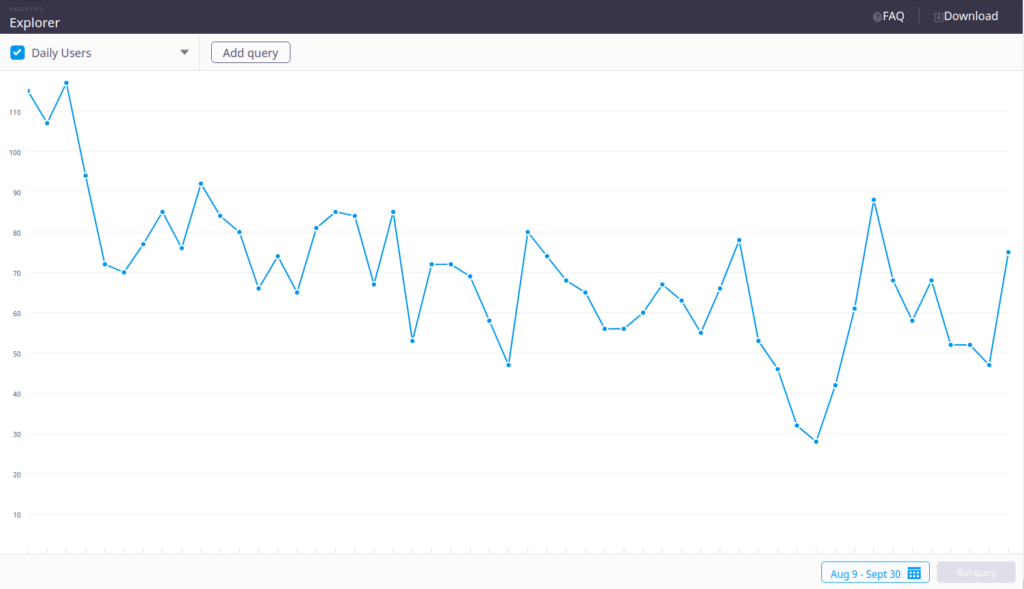
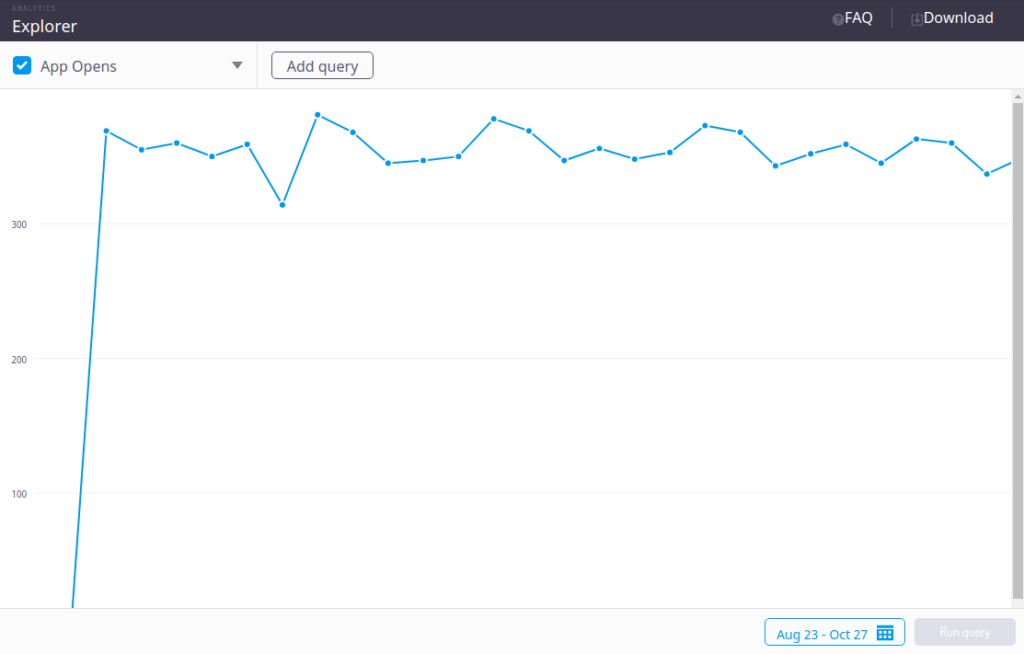
Our analytics tool allows you to build and track an array of real-time reports using our intuitive overlay graph tool: the Explorer. By using this all-in-one analyzing tool, you can display individual dimensions through separate chart shapes in a single graph. Each displayed metric will be in accordance with the color used to represent the specific metric’s name or value in the graph.
Optimize App Performance
Regarding requests and queries, this data analytics tool shows and also responds to multiple streamable values, including total requests, dropped requests, service requests, location-based queries, slow queries etc. After running an insightful analysis, you will be able to find out the exact number of dropped and served requests per minute, the request limit of your app per minute, the total number of requests your app is generating, and how your app requests are performing in order to check if you are losing any users.
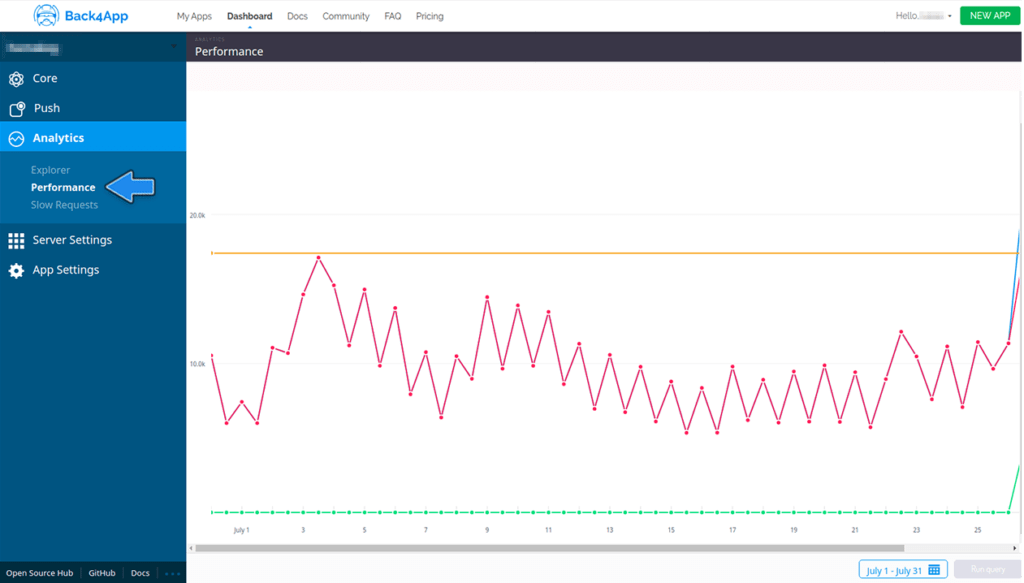
Start using Performance report Performance report to monitor your app requests behavior and check overall request response within a specific time.
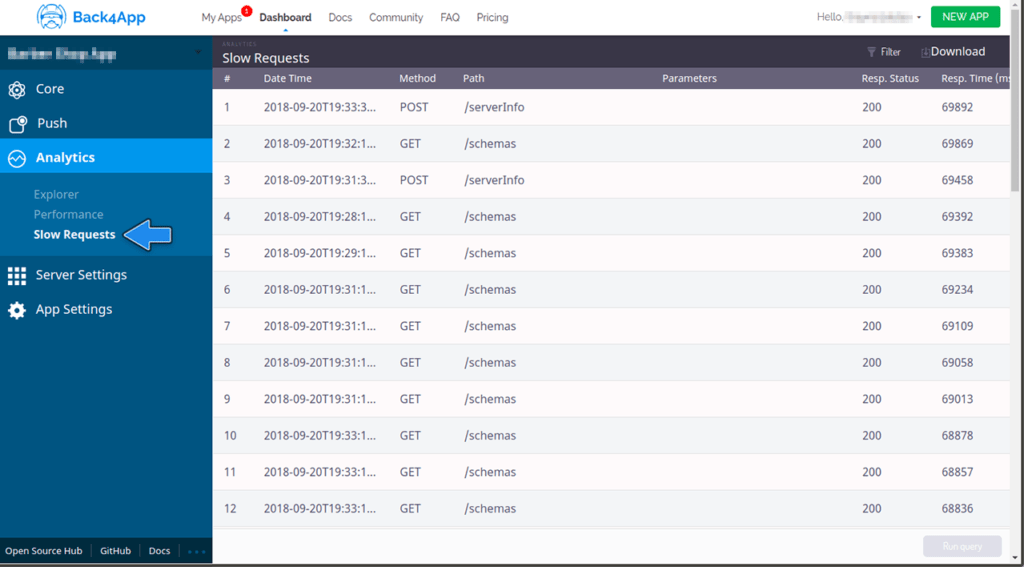
Back4App provides you with ‘Slow Query Tool’ to identify, analyze, and optimize slow, problematic queries so you can eliminate database bottlenecks and app lags without difficulty. Our tool offers rich insights into all running queries over a given time frame and then recognizes inefficient, bad queries that exceed the predefined amount of time to execute and cause bottlenecks. Additionally, it helps you pinpoint the root cause of any sort of app error within a query and investigate what exactly is happening with your app’s API requests in real-time, thereby improving your app’s user experience.
Real-Time, Real-Easy
In the world of big data, speed and accuracy is everything. Back4App analytics tool lets you work with a high-fidelity view of your app operations, such as app visitors and events, by automatically gathering incalculable data points and then processing and interpreting this information in real-time. As the name implies, these real-time reports provide you with comprehensive details about how your visitors are interacting with your app, how many users are currently installing your app, how your push campaigns or custom events are performing – the list is endless! Our progressive tool allows you to monitor every bit of activities on your app as they happen from moment to moment. In this way, you get real-time data updates every few seconds so you can quickly draw attention to every section including reports, campaigns, and events.
You will be able to view, analyze, and use your data and its related resources as soon as your app sends all the data points to our parse tool. By integrating Back4App SDK, the actionable, real-time data on your app’s growth and performance will automatically start assembling and will be available on your dashboard. In addition to that, you can keep tabs on analytics reports and metrics in real-time, which include traffic sources, conversions, and geographical location, based on device type, and REST verbs.
Is Parse analytics Free?
Yes, the Analytics is a Free, intuitive app analytics tool provided by Back4App that allows you to measure your app’s traffic, gather insightful data about your app visitors, conduct an in-depth visual analysis of data trends, and create unlimited custom reports, thereby enabling you to track your app’s progress and understand how it is performing in real-time.
How to optimize my app performance using Parse analytics?
Regarding requests and queries, this data analytics tool shows and also responds to multiple streamable values, including total requests, dropped requests, service requests, location-based queries, slow queries etc. After running an insightful analysis, you will be able to find out the exact number of dropped and served requests per minute, the request limit of your app per minute, the total number of requests your app is generating, and how your app requests are performing in order to check if you are losing any users.